Data rolling in....
 |
| Example of data recorded on seismic streamer after one pulse from the seismic sound source. This image shows a sound waves that have bounced off of the seafloor and underlying layers. After processing, it can be used to create a picture of geology under the seafloor. |
Ever since we finished rolling out the 15-km (~10 mile) seismic streamer
and seismic sound source, the seismic data have been rolling in. Each time we emit a pulse of sound waves from our seismic source, we acquire
recordings of seismic energy that have traveled into the earth, bounced off of rock
layers below the seafloor, and returned to the sea surface. The Langseth’s
seismic streamer has 1200 channels that record returning sound waves at a
sample rate of only 2 milliseconds for 26 seconds – enough time for seismic
energy that has traveled deep into the earth to return to the sea surface and
be recorded by the seismic streamer before generating a new pulse of sound
waves. Each time we set off the seismic
source and record 26 seconds of data, we create 62 Mb of data. Repeat that every 30 seconds for a week, and you
have a LOT of data! So far, we have collected 1.2 Tb of seiLangseth or the recordings on
the ocean bottom seismometers deployed on the seafloor.
smic
data, not including all of the other geophysical and oceanographic data acquired
by the  |
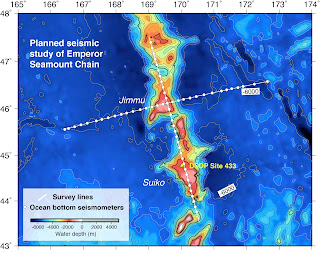
| Map of the areas where we have already collected data and where we plan to collect data for the rest of the cruise. |
Besides collecting these data, we are also beginning to
analyze it (between ping pong games...). We will only be able to do
preliminary analysis at sea, but it still will give us a first taste of what the data
will tell us about earth structure. Stay
tuned….
Donna Shillington, LDEO

Comments
Post a Comment